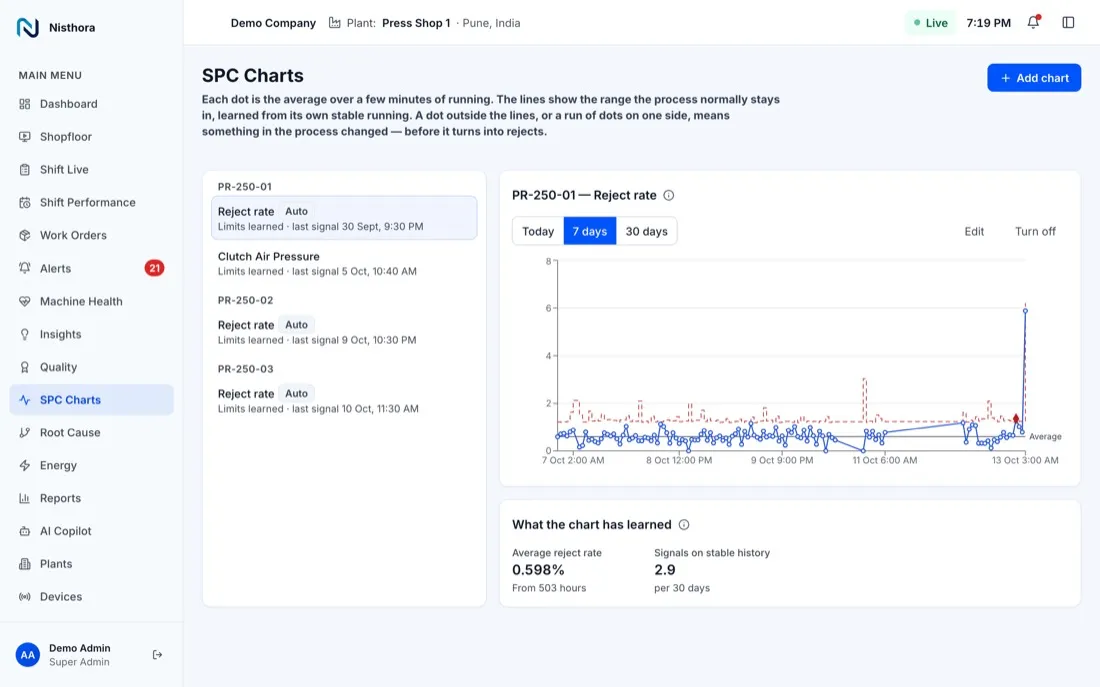
SPC chart
Limits learned from your own running.
Each dot is the average over a few minutes of running. The lines show the range the process normally stays in, learned from its own stable running. A dot outside the lines, or a run of dots on one side, means something changed.
- Reject rate charted for every machine with a reject counter
- Shows what the chart has learned: the average and how often it signals
- Today, 7 days or 30 days