Predictive analysis
Predictive maintenance: see wear coming, with the reasons
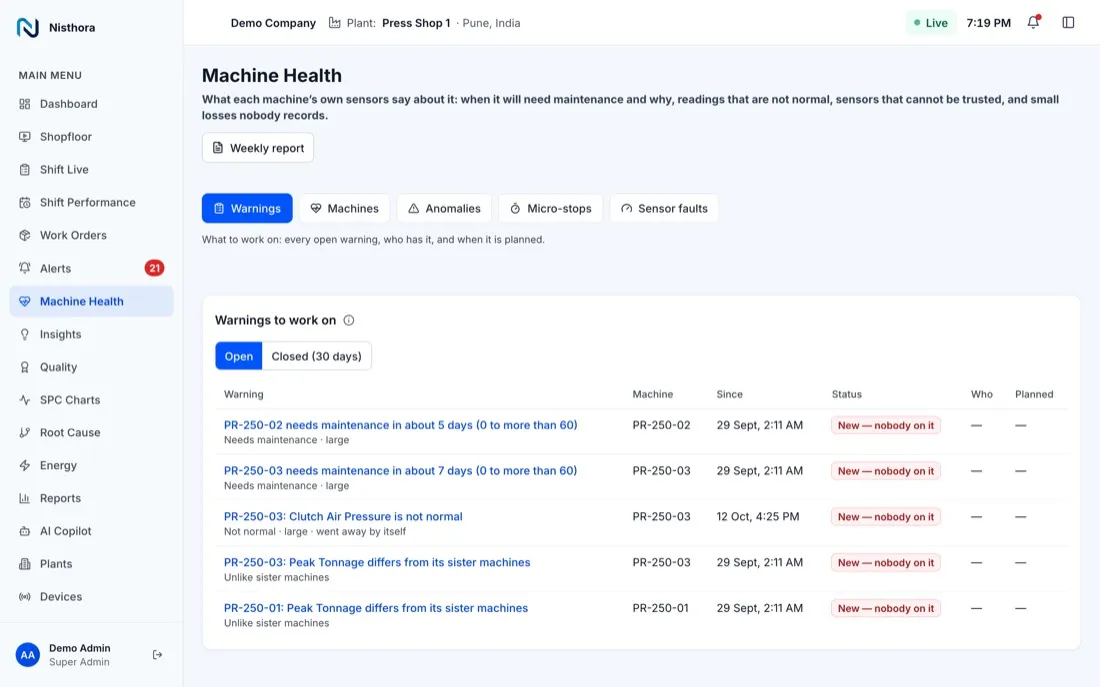
Every night, Nisthora looks at how each machine's readings have been moving and how often it has broken down. When a trend is heading out of its normal range, it estimates how many days are left, and says why.
How it works
Two kinds of evidence, both from your own machine.
| Part | What it does |
|---|---|
| Wear trends | For each sensor, one typical value a day, and its gap from what the other sensors say it should be (motor current for this speed). If the last 30 days show a real trend heading out of the normal range, it estimates the days left, with a range. |
| Breakdown rhythm | Learns the running hours between breakdowns (stops whose reason is marked as a breakdown). Used only when the machine really shows wear-out; random breakdowns say nothing about when the next one comes. |
| Plain-English reasons | For example: "Main motor current is rising by 0.6 A a day for its speed. At this rate it leaves its normal range in about 12 days (8 to 19)." |
| Nightly run | The models re-learn every night from the latest history, so the forecast stays current. |
Honest about data
Measured, not promised.
- Your machines' own historyModels learn from your plant's readings, never from sample data from somewhere else.
- Needs time to learnThe forecast starts after about 90 days of a machine running. Until then the screen says "Learning".
- Checks its own recordThe rule is replayed on every past day and scored against the breakdowns that really happened: how many it warned of, how far ahead, and how many warnings led to nothing.
- Better with stop reasonsWhen operators give each stop a reason on the machine panel, the forecast can learn from real breakdowns.
See Nisthora on your own machines.
Book a demo. We will show you live data and talk through your machines, lines and shifts.